Martech Dashboard
UX Design / UI Design / Wireframing / Prototyping

My Role
Lead UX Designer
Timeline
5 months (on going)
Overview
This project has been a great opportunity to dive into a digital Product with various users as well as a deep amount of information architecture. This products has come as a solution to Snaplisting's (a marketing agency) needs. We wanted to improve our reporting on ad campaigns while also allowing clients the ability to get a pulse check on how their campaign was performing.
During this project I have had a chance to work cross functionally across many teams and understand what the business needs. To our knowledge there is not a tool that does quite what this will do. Showing reporting data along with all creative across a marketing funnel.
SOLUTION HIGHLIGHTS
A Data Dashboard to Analyze a campaign post launch


THE PROBLEM
How can we improve the efficiency of our campaign Reporting and inform our clients
Problems to Solve For:
What data is important to report on
Should their be two versions of the data we show
How do we achieve this on the development side
RESEARCH
Understanding the steps of a marketing funnel flow
Deeper Dive
First we need to understand what the business does and what is important to our core users. We achieved this through ideations sessions between design and the marketing team
Marketing Funnel Flow

Understanding the marketing funnel was critical to the core user as well.
Information Architecture

We boiled down what information was important to report on and standardize it across all campaigns.
The Data Behind It All
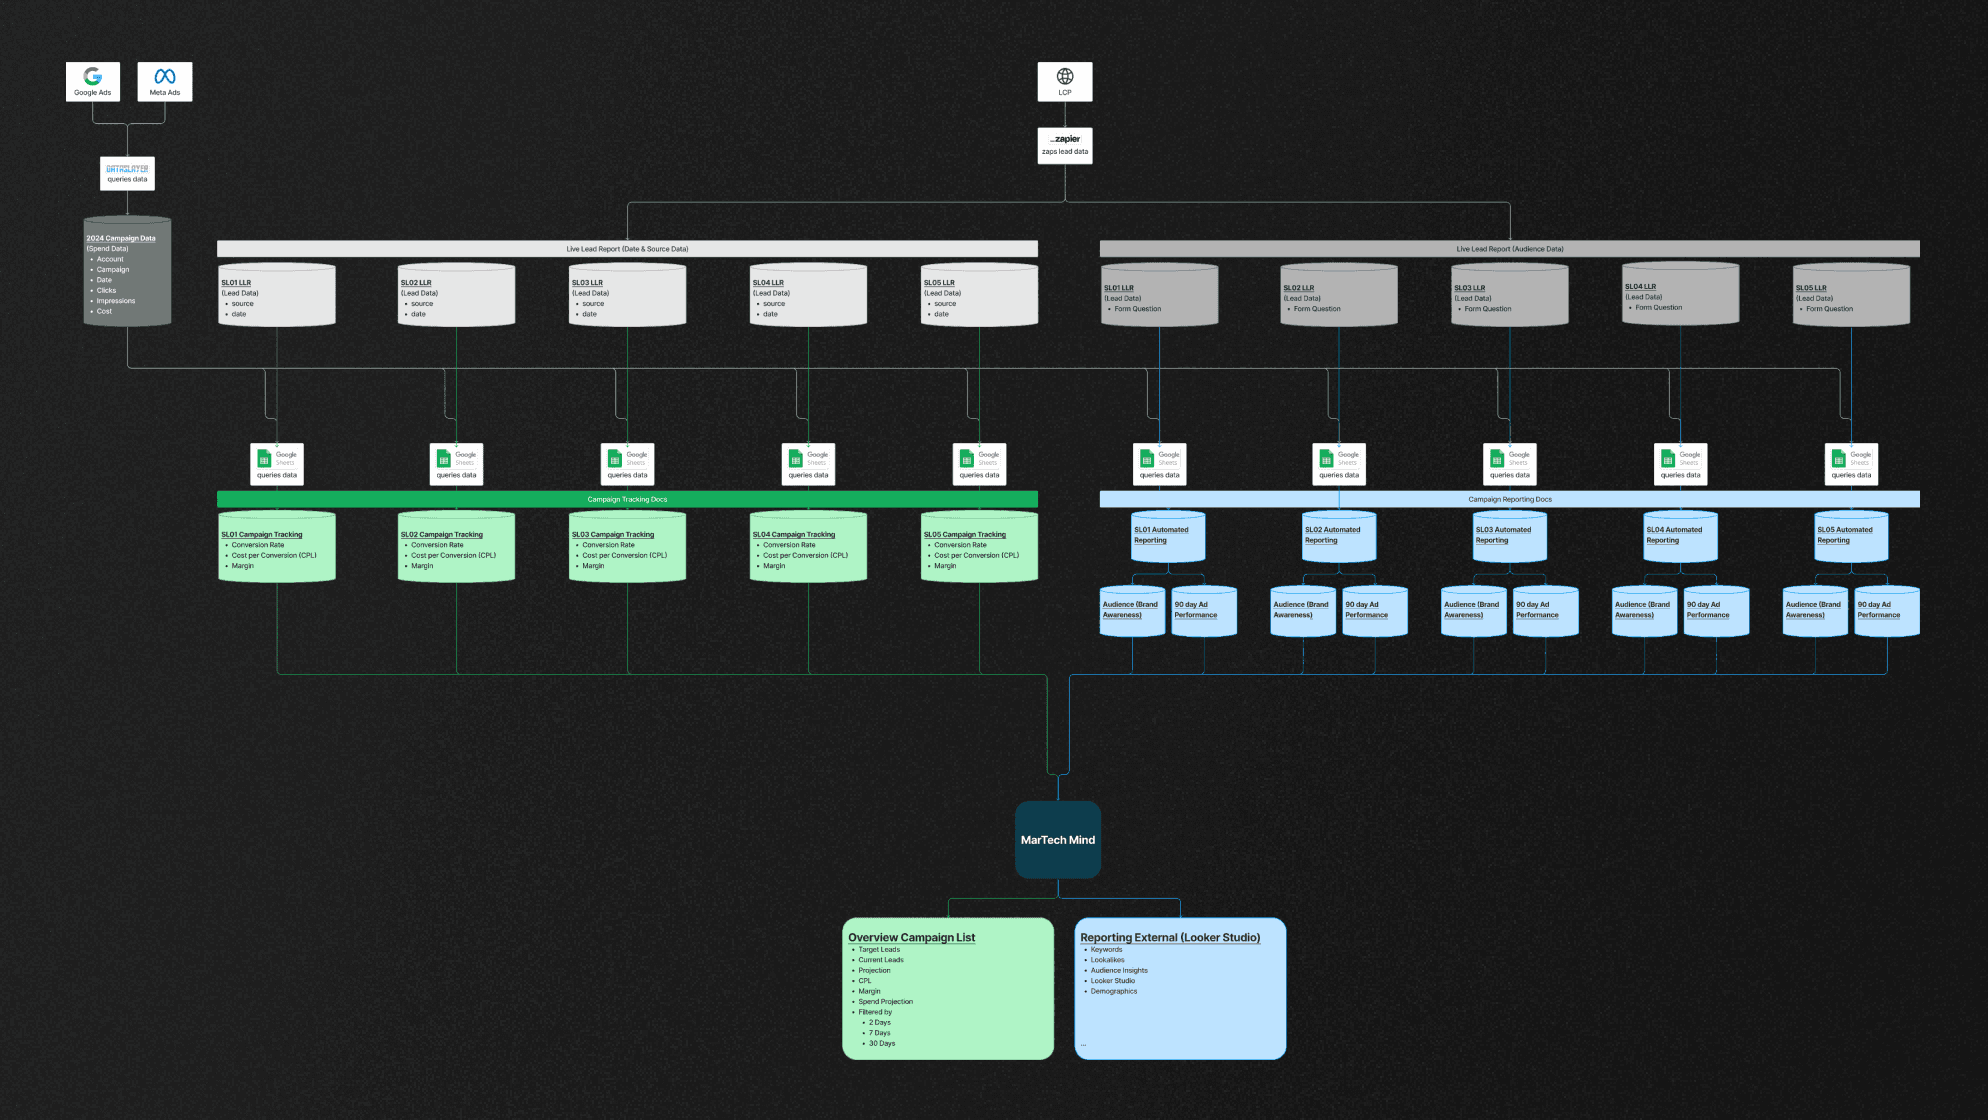
This was a really fun collaborative experience with different team members. We broke down how our tracking data would actually inform this product. The information would serve two functions:
Reporting for the analyst and a client facing dashboard.
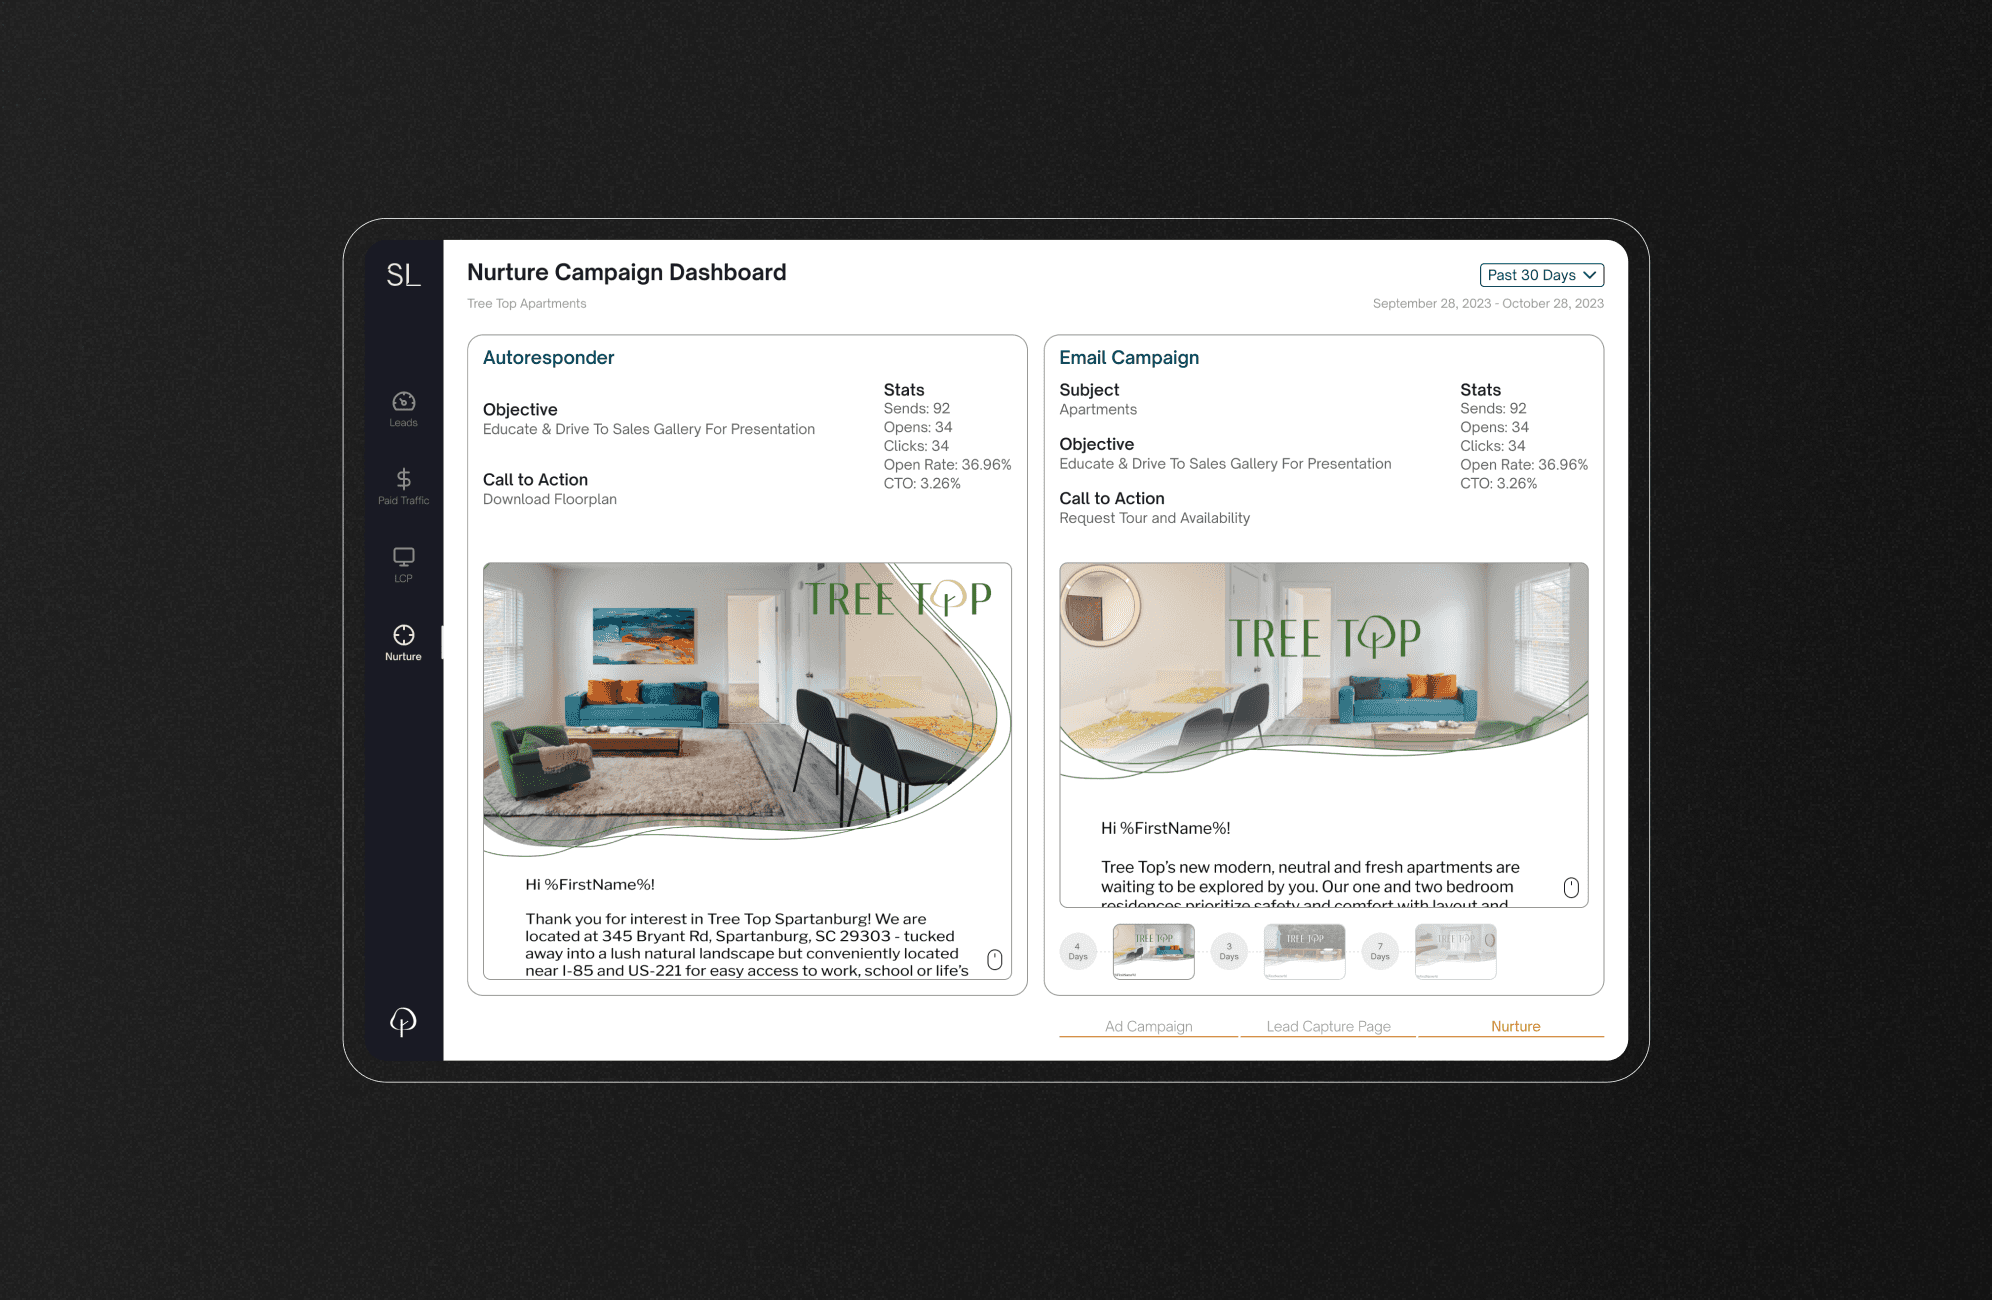
FINAL DESIGN
Creating a dynamic and functional Prototype
Deeper Dive
In order to really test to see if we wanted to pursue this as a viable solution for the agency we needed to create a robust prototype that we would input real data from a live campaign. Despite being a lot of manual entry it was important for us to see that this could work.
Hi Fi
Component Set Up

Leveraging components helped mitigate confusion for the team to input the actual reporting data with out messing up the prototype.
RETROSPECTIVE
Exploring viable solutions for development and data architecture
Deeper Dive
Now that we have a strong visual representation we are exploring options to execute this. There are many qestions to ask and data to clean up. Some of the actionalble steps we have been doing is standerdizing our CSVs for our reports while also looking into to viable solutions like Google Looker studio.